The 10 manufacturing KPIs you should track
You do not need a KPI glossary to know that overall equipment effectiveness (OEE), on-time in-full (OTIF), cycle time, scrap rate, first pass yield, throughput, schedule adherence, and inventory accuracy matter. The harder problem is that these numbers often reach the team too late and too detached from the work to change anything: the order has already slipped, the batch has already produced scrap, or the customer promise is already at risk.
This article covers the 10 manufacturing KPIs worth tracking and what you should expect from your ERP when it comes to these metrics. A modern production KPI dashboard should help the team act while there is still time to improve the plan, not just record the score after the fact.
1. OEE: availability, performance, and quality losses
OEE, or overall equipment effectiveness, combines availability, performance, and quality into one measure of how effectively equipment is used.
OEE = availability x performance x quality
The number is useful only if the ERP keeps the three losses separate. Low availability can point to downtime, changeovers, missing labor, or unrealistic planning. Low performance can point to micro-stops, speed loss, routing issues, or materials that slow the line down. Low quality can point to scrap, rework, unstable settings, or unclear instructions.
Your ERP should connect OEE to the work behind it: production orders, work centers, downtime reasons, planned versus actual output, quality results, and the materials or batches involved. A single OEE average makes it too difficult to dig into the underlying cause and too hard to act on.
2. OTIF
OTIF, or on-time in-full, measures whether the customer received the full order on the promised date. The more useful ERP view is forward-looking: which customer promises are already at risk because a batch is blocked, a supplier receipt is late, or a work order is slipping?
Your ERP should calculate OTIF from live order, production, inventory, quality, and shipping data. It should also show why the promise is at risk, not just that it failed: late supplier receipt, stock in the wrong location, quality hold, capacity conflict, or a production order running behind plan.
3. Cycle time
Cycle time measures how long it takes to complete a process, operation, or production order from start to finish. The dashboard becomes useful when it separates active production time from waiting time, then shows which standards are still realistic enough to plan from.
Your ERP should show planned cycle time, actual cycle time, and variance by product, operation, work center, and order type. If current cycle time does not feed planning and lead-time promises, the KPI only explains why the last plan failed instead of helping the team give customers better dates next time.
4. Scrap rate
Scrap rate measures the percentage of material or output that cannot be sold, used, or reworked. A dashboard that stops at total scrap tells the team the cost, but not the intervention.
Your ERP should tie scrap to the work order, operation, material lot, supplier batch, operator declaration, quality check, and reason code. It should also update stock immediately. Scrapped material is not available stock, and a batch with abnormal scrap may change what purchasing, planning, and costing need to believe.
5. First pass yield
First pass yield measures the percentage of units that pass through a process correctly the first time, without rework, repair, or repeat inspection. A final yield number can still look acceptable even when the process needed hours of rework to get there; first pass yield catches that hidden work.
Your ERP should record quality results where they happen, connect failures to the relevant operation and batch, and distinguish scrap from rework. First pass yield is not only a quality KPI; it is a capacity signal, because rework consumes labor, machine time, materials, and schedule space the plan may still be treating as available.
6. Throughput
Throughput measures how much good output the factory produces over a defined period. Depending on the business, that may mean units, weight, volume, batches, orders, or another production unit that reflects how the factory works.
Your ERP should calculate throughput from completed production events, not wait for someone to summarize output by hand. It should show good output in the context of actual demand, so the team can tell whether production is making what customer orders and forecasts require. Producing more of the wrong item does not help OTIF, cash, or stock reliability.
7. Schedule adherence
Schedule adherence measures whether production happens according to the plan. The ERP version should not stop at a percentage; it should show which work orders drifted, why the plan changed, and which downstream promises are now exposed.
Your ERP should show schedule adherence at the level where the team can respond: work order, operation, work center, shift, and priority. It should also record why the plan changed. Without reason codes or event history, schedule adherence becomes a blame metric instead of a planning tool.
8. Inventory accuracy
Inventory accuracy measures whether the stock recorded in the system matches what is physically available, reserved, blocked, consumed, or ready to ship.
Your ERP should distinguish available, reserved, quarantined, expired, allocated, in transit, and blocked stock. For batch, lot, or serial-controlled manufacturers, accuracy also includes identity: which batch it is, where it sits, and whether it can be used for a specific order.
9. Changeover time
Changeover time measures how long it takes to switch a work center, line, or process from one product, batch, format, color, recipe, tool, or configuration to another.
Your ERP should track planned and actual changeover time by product combination, line, work center, and operation. It should also help the team see when grouping similar products, formats, allergens, colors, or materials would reduce avoidable downtime. The output should be a better sequence, not a chart that explains yesterday's loss.
10. Labor productivity
Labor productivity measures output against labor input. The exact formula depends on the factory: units per labor hour, value added per labor hour, orders completed per shift, or standard hours versus actual hours.
Your ERP should connect labor declarations to work orders, operations, output, quality, and interruptions. A low productivity number means very different things if the operator spent the shift waiting for material, fixing quality issues, or working through unclear instructions. If the ERP only produces a leaderboard, it is not helping much.
What your production KPI dashboard should do
A production KPI dashboard should do more than display the numbers for passive consumption. It should be a live operating surface connected to the work: orders, stock, purchasing, planning, production, quality, internal logistics, and shipping preparation.
For each KPI, the system behind the dashboard should answer four questions:
- What is happening now?
- What changed from the plan?
- Which orders, materials, batches, machines, or customers are affected?
- What should the team do next?
That means the ERP has to do more than store records. It has to capture data as work happens, keep the relationships between events intact, and surface exceptions early enough for someone to act.
For OEE, that means moving from a percentage to the availability, performance, and quality losses behind it. For OTIF, it means showing future delivery promises at risk. For first pass yield, it means connecting quality failures to operations and rework. For scrap rate, it means tying loss to materials, suppliers, batches, machines, and reason codes. For cycle time, it means showing where work is active and where it is waiting.
Reporting belongs inside the ERP, not beside it. When the dashboard sits outside the operational system, the team has to export data, clean it, and rebuild the missing context before anyone can make a decision.
How Bonx delivers manufacturing KPIs
Bonx is an AI-native manufacturing ERP and, unlike traditional ERPs, a system of action. It connects order management, inventory, purchasing and supplier management, planning, production, quality, traceability, and internal logistics, then helps routine work move instead of waiting for the team to update records after the fact.
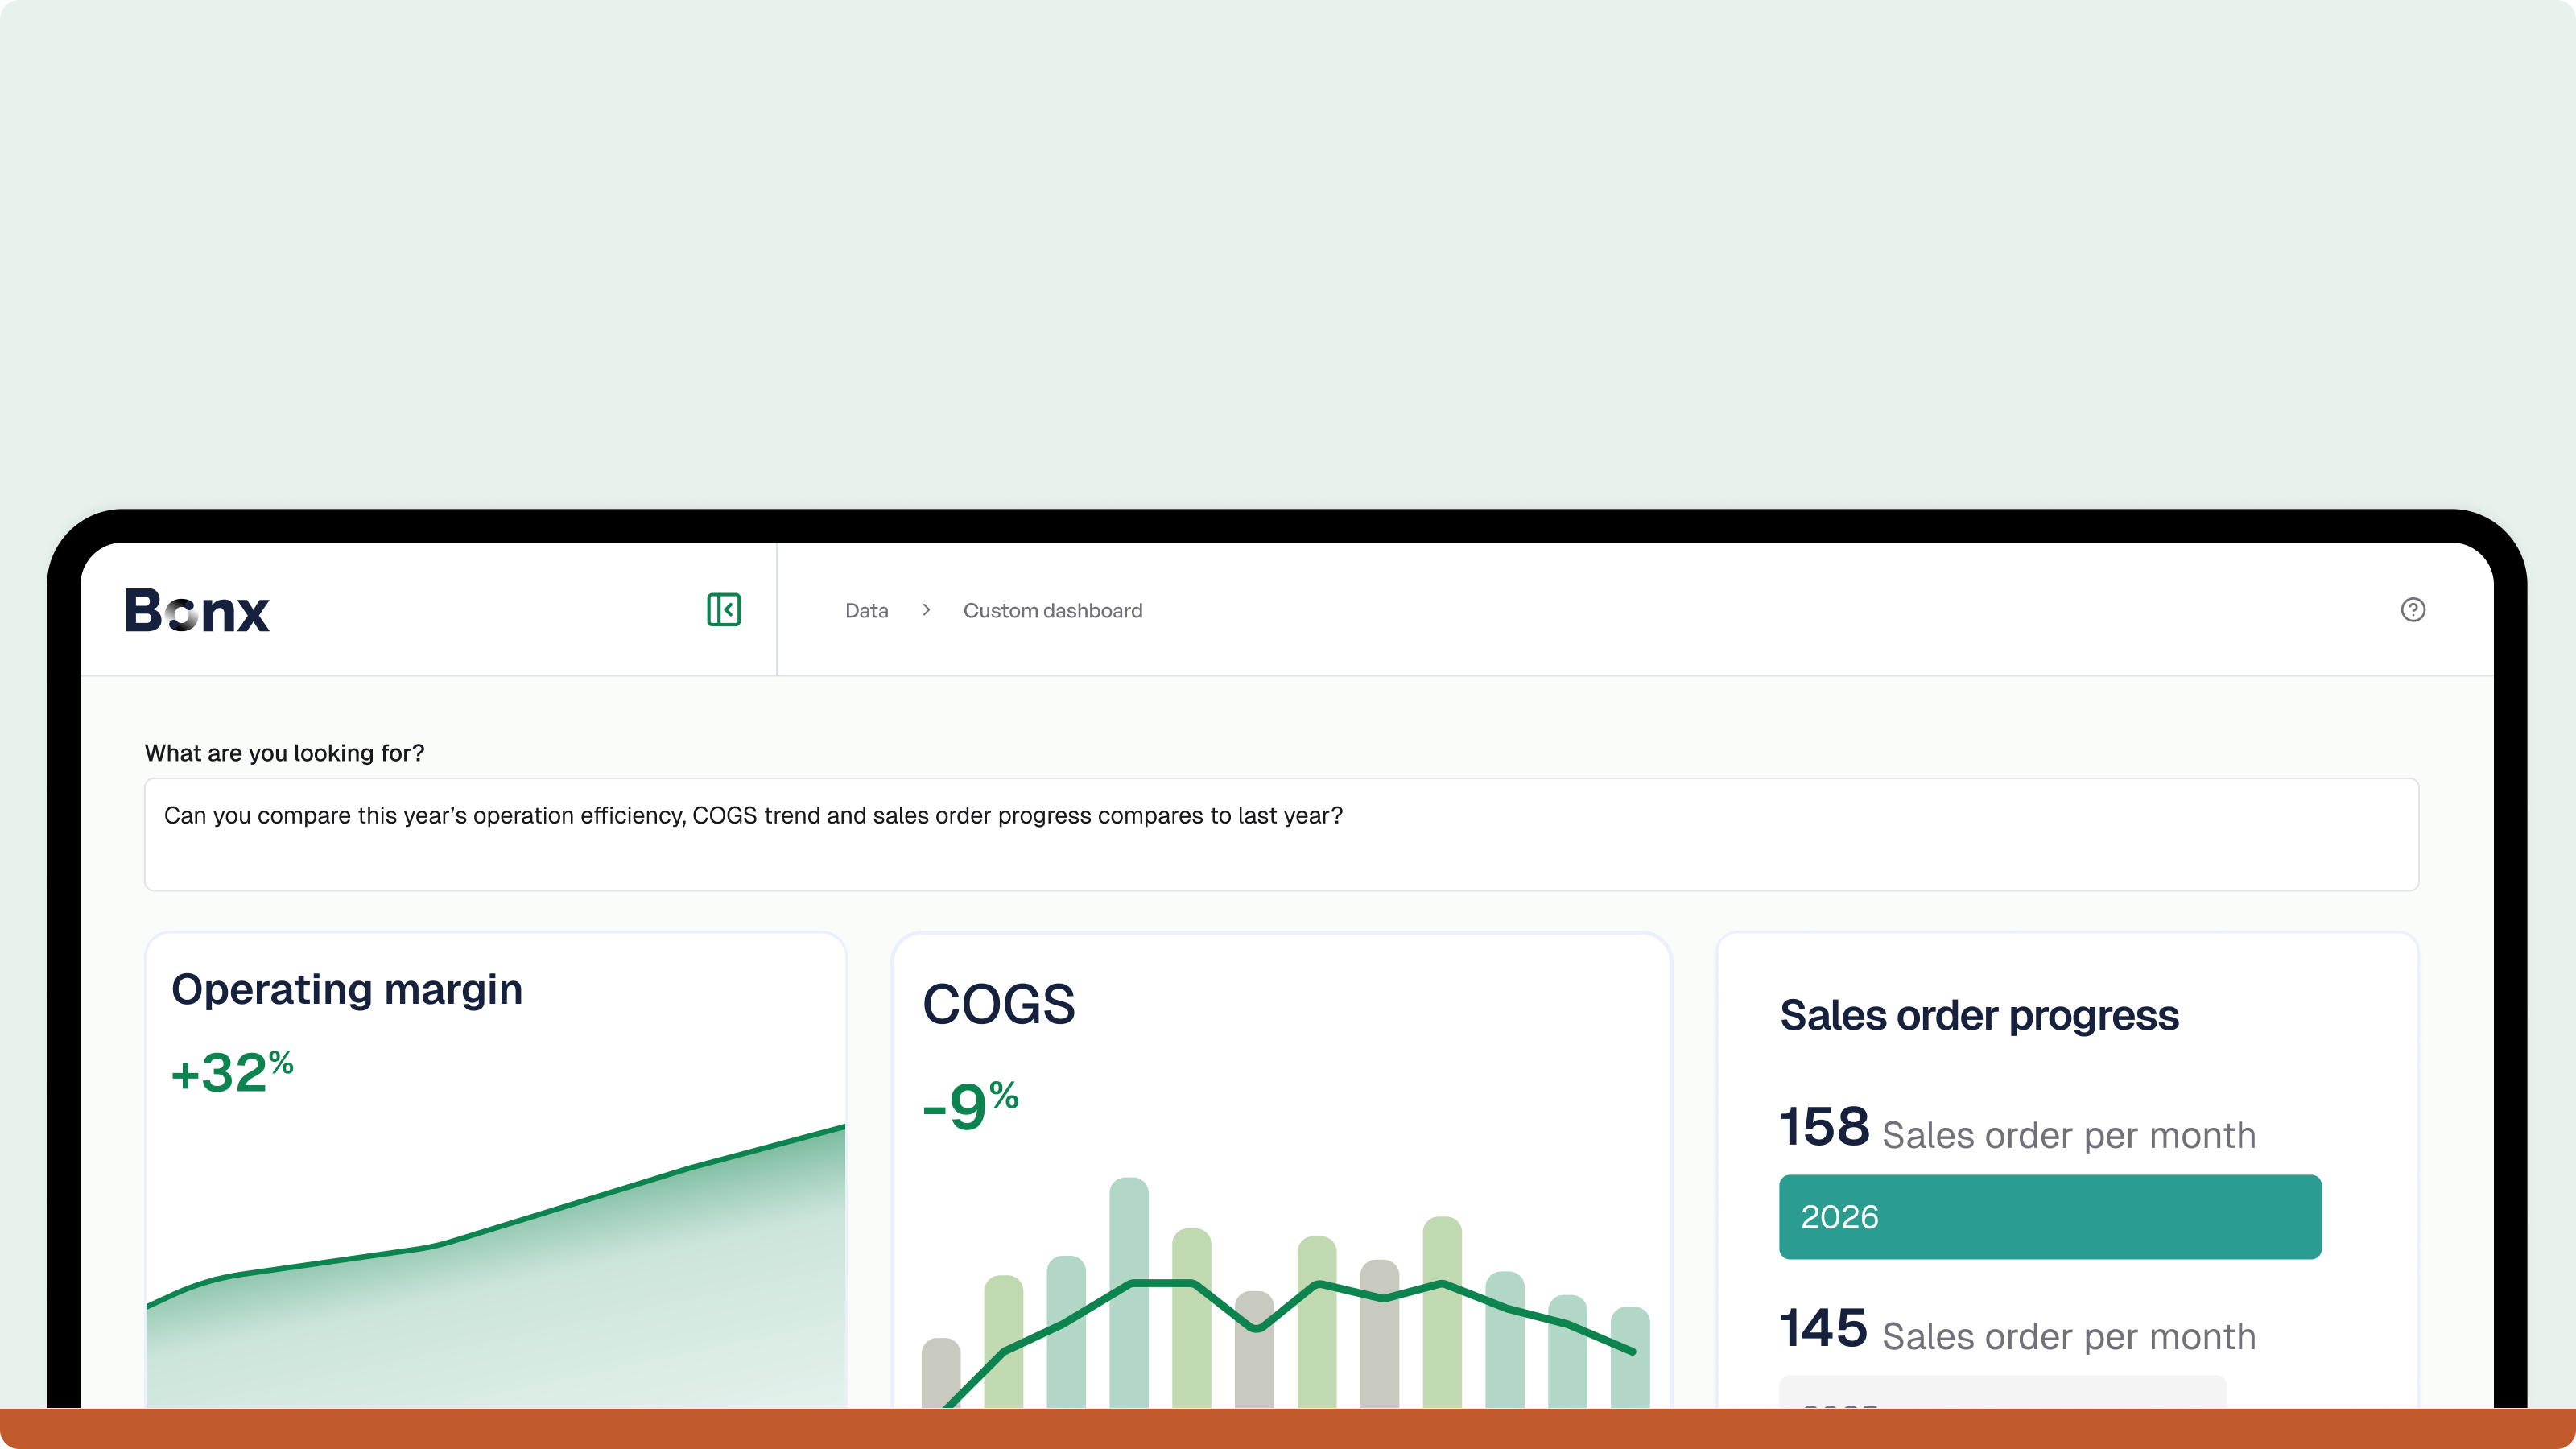
Inside Bonx, Analyze & Decide is the layer for custom dashboards and AI-powered analysis built directly into the operational system. Teams can build dashboards for the factory, track real-time KPIs across production, procurement, and inventory, share dashboard views across teams, and use multi-site or multi-entity visibility when the operation is spread across locations.
The same events that run the operation feed the numbers. A production declaration can update progress, stock, quality, schedule status, and the relevant dashboard. A quality hold can affect available inventory and customer promises. A late supplier receipt can show up in purchasing and in the production orders it puts at risk.
Analyze & Decide also brings the "how" closer to the user. Instead of exporting data to another reporting tool, teams can use a drag-and-drop dashboard builder, ask natural language questions on operational data, and rely on automated anomaly detection or root cause suggestions when a KPI moves in the wrong direction. That gives teams decision support directly inside Bonx, not another chart to interpret somewhere else.
Bonx customers prove the point in daily operations. LCS implemented Bonx for real-time production tracking across five textile workshops, replacing paper work orders with QR-scanned manufacturing orders and cutting production errors by 95% while reducing paper usage by 90%. La Maillecotech uses Bonx so operators spend minutes on production tracking instead of an hour a day, giving managers cleaner production data without asking the floor to carry extra admin. L'Atelier du Ferment connected production planning, batch traceability, Sidely, and Pennylane with Bonx, while Bonx helps prepare manufacturing orders and procurement suggestions from sales demand, shelf life, and cold storage capacity.
KPI visibility is not a reporting project by itself. It comes from an operational system people actually use. If operators declare work in one place, quality records live somewhere else, stock is corrected later, and planning runs in a spreadsheet, the production KPI dashboard will always be late or incomplete.
With Bonx, KPI logic sits closer to the work itself. When a dashboard shows that OTIF is at risk, first pass yield is falling, or cycle time is drifting, the same system can surface the affected orders, prepare procurement suggestions, prioritize stock, generate manufacturing orders, or trigger other routine operational work under human oversight. Better reporting is part of it; the larger gain is less time spent reconstructing what happened and more time acting while the plan can still change.
How to choose which KPIs matter first
The 10 manufacturing KPIs above are a strong starting point, but the right order depends on the problem the business is trying to solve.
If customers are losing trust, start with OTIF, schedule adherence, and the causes behind late or incomplete orders. If margin is under pressure, look at scrap rate, first pass yield, changeover time, and throughput. If production capacity feels mysterious, start with OEE, cycle time, schedule adherence, and labor productivity. If every plan breaks because the system cannot be trusted, inventory accuracy may be the first KPI to fix.
The ERP should make that prioritization easier. It should show which KPI is failing, where the failure starts, and which operational decisions are affected.
When you evaluate an ERP, ask the vendor to show the chain. How does a production event become an OEE update? How does a quality failure change first pass yield, inventory status, and the affected order? How does a late purchase receipt show up in OTIF risk? How does cycle time data feed the next production plan?
If the answer depends on exports, spreadsheet cleanup, or a reporting specialist, the ERP is not really carrying your manufacturing KPIs. It is just holding some of the data until someone else does the work.
FAQ on manufacturing KPIs
What are the most important manufacturing KPIs?
The most important manufacturing KPIs usually include OEE, OTIF, cycle time, scrap rate, first pass yield, throughput, schedule adherence, inventory accuracy, changeover time, and labor productivity. The best starting point depends on the operational problem: customer reliability, capacity, cost, quality, or stock trust.
What does OEE mean in manufacturing?
OEE means overall equipment effectiveness. It measures how effectively equipment is used by combining availability, performance, and quality. A useful OEE view should show the losses behind the number, instead of stopping at the final percentage.
How do you calculate OEE?
OEE is usually calculated as availability x performance x quality. Availability shows whether equipment ran when planned, performance shows whether it ran at the expected speed, and quality shows how much good output came through the process.
What is a production KPI dashboard?
A production KPI dashboard is a live view of factory performance across metrics such as OEE, OTIF, cycle time, scrap rate, first pass yield, throughput, and schedule adherence. It should be connected to real production, inventory, quality, and order data so teams can act before problems become customer failures.
What is first pass yield?
First pass yield measures the percentage of units that pass through a process correctly the first time, without rework, repair, or repeat inspection. It helps reveal process stability and hidden capacity loss that final quality numbers can miss.
What should an ERP do with manufacturing KPIs?
An ERP should calculate manufacturing KPIs from live operational data, connect each number to the orders, materials, batches, work centers, and quality events behind it, and surface exceptions early enough for the team to act. If the KPI only appears after exports and cleanup, the ERP is not doing enough.

Tired of your ERP working against you?
So were we. That's why we built Bonx, the AI-native manufacturing ERP.